Deal Notables: Less on SmashFly and more on the lead investor….OpenView has a pretty unique model as far as VC firms go in that they have a specific charter as a firm (high-growth, scale-ready, B2B SaaS) but also have a dedicated group, OpenView Labs, that acts as an operational consultant to OpenView’s portfolio companies. When a company with product-market-fit is looking to scale, we can only imagine how invaluable Labs must be in terms of providing structure and process to the company vision. Needless to say, we are intrigued by the concept! Learn more about Labs here!
P.S. Labs produces a weekly newsletter that is required reading here at C:V. so we highly recommend you sign up too!
And the first powerhouse is out! The Group of Death was too much for the Discounted Cash Flow method. But with the seeming favorite out, how did the other metrics play out?
EV/Sales and EV/EBITDA advance!
Game 1: Enterprise Value/Sales 5-1 Discounted Cash Flow
Game 2: Enterprise Value/EBITDA 3-2 Enterprise Value/Sales Expense
Game 3: Enterprise Value/Sales Expense 2-0 Discounted Cash Flow
Game 4: Enterprise Value/EBITDA 2-2 Enterprise Value/Sales
Game 5: Discounted Cash Flow 0-3 Enterprise Value/EBITDA
Game 6: Enterprise Value/Sales 3-1 Enterprise Value/Sales Expense
Closest Match With only one draw in the group, it’s evident that EV/Sales and EV/EBITDA are contenders at the top of their games. Both have the strength to go deep in the tournament… perhaps looking reminiscent of Brazil and Mexico in that other World Cup, especially if El Tri can keep getting performances like that out of Ochoa! But we digress. Let’s look at these metrics’ respective advantages:
For the EV/Sales multiple, it’s about simplicity. You can approach a company with negative cash flows and still capture the majority of the growth potential as an investor. It’s also much easier to project revenue than revenue and a full cost structure. Fewer variables to get wrong means a clearer picture of expected value. It’s like having one superstar who you can count on for at least a goal a game (re: Neymar, Messi).
EV/EBITDA takes a more complete approach to valuation, considering the cost of doing business which can vary significantly between even similar business models. It also doesn’t get bogged down in non-cash expenses or potential tax breaks, like the DCF or even the disqualified EV/Earnings. It’s like a long-lost love child of EV/Sales and EV/Sales Expense, à la Czechoslovakia, except this combo’s still kicking!
Biggest Blow Out Discounted Cash Flow took an early walloping from EV/Sales, and was never the same. In our Group B preview, we compared the complexity of the DCF model to the Spanish tiki-taka futbol… little did we realize we had made two bold predictions in one! Realistically, the DCF was simply out of its element. Just think – precision passing and team-focused play led the Spurs to an NBA Championship but came up short for Spain in the World Cup.1 In this bracket, as in the Spaniard’s loss, simplicity is beautiful:
Memorable Moment EV/Sales Expense thought their claim as the only measure that took into account the cost-per-sale metric might be defensible. But during their head-to-head with EV/EBITDA they looked about as lost as Mr. Yoshida trying to defend James Rodríguez…
1Spain seems to be one of the only World Cup countries not represented on the Spurs’ 15-man roster: Argentina, Australia (twice), Brazil, France (twice), Italy, and the United States.
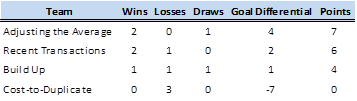
The first group saw three teams tightly compete for the two knockout positions and one barely show up all of group play. The key to advancing out of Group A was a given method’s ability to recognize current trends in the market and its flexibility to capture those in the valuation.
Group A – 1. Adjusting the Average and 4. Recent Transactions Move On!
Game 1: Cost-to-Duplicate 0-3 Adjusting the Average
Game 2: Recent Transactions 3-2 Build Up
Game 3: Adjusting the Average 2-1 Recent Transactions
Game 4: Build-Up 2-0 Cost-to-Duplicate
Game 5: Cost-to-Duplicate 0-2 Recent Transactions
Game 6: Build-Up 2-2 Adjusting the Average
Closest Match With two of the six matches resulting in draws, this group was reasonably balanced. The match-up between Adjusting the Average and Build Up methods was certainly the most evenly matched, with both attempting to quantify intrinsic qualities of companies. It’s hard to say which method is better, since they both rely on subjective opinions of the companies to derive a hard numeric value.
Since this match-up failed to decide who would advance, it came down to their respective matches against Recent Transactions, the eventual group runner-up. Adjusting the Average matched the Recent Transactions in terms of relying on current market conditions to establish a base value. The Build Up method, despite its similar structure, had little flexibility for changes in market conditions without adjusting each block used to build a valuation.
Biggest Blow Out
Cost-to-Duplicate against Adjusting the Average looked a little like the Swiss taking on the French: simply outmatched from the get-go. Cost-to-Duplicate’s real struggle was that it wasn’t grounded in current market expectations, but only looked to the “qualification games” and what it took to reach group play. This can result in severe undervaluation of promising early entries entering large markets – just the type of company a VC dreams about nightly!
Memorable Moment On the last day of group play, Adjusting the Average recognized, and perfectly accounted for, a company’s ability to go to market without another round of funding. This ensured an undiluted return late in the second half as an equalizer against the Build Up method, which consequently led to Recent Transactions stealing the final advancing spot!
What Lies Ahead: We will be finishing up group play this week in our Valuation World Cup and announcing the knockout round pairings. Also expect a Round of the Week. In other notes, we have moved away from a weekly VC spotlight and will now do them periodically as we find cool/fun people to feature!
SpotlightTMS is looking to become the box office for all corporate tickets and events. Their $6M Series A will help them continue down that path. Their software helps companies manage their ticket distribution and measures ROI on the events. Pretty neat niche to disrupt if you ask us! (well, not really a niche seeing that it’s a $20B market…)
Deal Notables: “The company’s typical client spends about $3,350 a year to use Spotlight. But its largest clients are paying over $500,000 a year to manage their tickets and other assets through the Spotlight system.” Those are some pretty far-ranging LCV’s if you ask us! We have a feeling they are all over their customer/business metrics but who knows, maybe the should check out our Valuation World Cup for some additional ideas (and you should too)!
Here is the final group, Group D, the rest of the rest. This group is the wildcard group with entrants coming from all different areas and valuation methodologies. It will be interesting to see how they match up against each other with their contrasting styles and formations.
Ownership %
Explanation and Use Case
The ownership % method is purely a math formula applied to the amount investors will own after a round has been raised. This can be very common for early stage deals and the prevailing wisdom is that A round investors get about 30% of a company. The idea behind this method is less about the company performance and more about the investor’s expected return and what ownership percentage is required to obtain that.
Pros and Cons
Ownership % main benefit is simplicity. There are neither metrics (LCV, MAU) nor elaborate spreadsheets (DCF), there is simply a formula for pre money + investment = post money and whatever the investment % of the post money amount is the ownership. Ownership % can be equated to differing formations on the pitch. While any given team may have a 4-4-2 or a 4-2-3-1, they will always have 11 (10 + goalie) on the pitch to start the game. It is simply a combination (formula) of where the players will line up. The downfall of Ownership % is also its simplicity. It doesn’t factor in any real relevant business metrics in the formula.
Example
CrashPad, an Airbnb competitor is raising its Series A round of funding of $2M. Their investors have a requirement of 25% ownership of any company they invest in at A round. Total Value: $8M
Acquisition Value (Attach Rate)
Explanation and Use Case
A lot of pundits have been questioning some of the prices of some of the mega acquisitions of recent (WhatsApp) and how the purchasing companies can justify the value. The acquisition value (attach rate) method can be a great way to logically justify these prices. This method takes into consideration not just the existing customer base and operations of the target company, but more importantly, how they would fit with the acquiring company’s business model and customer base. For more information, see Marc Andreessen’s set of tweets on the topic. This is similar to how a player with dual eligibility for two countries (re: John Brooks, Julian Green, etc.) can be seen in a different light by each country’s coach. In the case of the German-American’s, they felt (and Jurgen helped persuade them) their value would be best realized on the USA squad rather than the German one and chose accordingly.
Pros and Cons
The attach rate method is a strong contender in this year’s pool because of its ability to take a holistic approach to valuing the company as an integrated piece of the existing company with synergies and economies of scale realized. This can also be risky because if a company misjudges their attach rate or has issues integrating the acquired company into their processes and systems, the synergies expected may take longer to realize or even worse not materialize at all.
Example
CyberStop, an enterprise security software firm has a solid business of $100M in revenues and growing at 10% annually. IT powerhouse F-P is looking to gain a foothold in the security space and feels it can bundle CyberStop’s product into 15% of its $50B in hardware sales a year. Total Value: $7.5B
Enterprise Value/Patent
Explanation and Use Case
The EV/Patent multiple is a great way for companies with lots of IP or R&D and little to no revenue to find a rational way to determine their value. In select industries, IP, Patents, and FDA approvals can be extremely valuable assets from their outset even if they do not generate revenue immediately. These can be leading indicators of future revenue streams and as a result, early stage companies can use them as a proxy for value in the interim.
Pros and Cons
Patent approval can be a great thing; it can allow you to have full utility and control over the selected process or technology that you are developing allowing you to capitalize on the revenue opportunity when the product is fully developed. The downfall of this is that just because you own the patent, you have no guarantee that the technology can be turned into a successful business. Similar to how some countries fill their World Cup roster with young, unproven players in the hopes they can grow to become superstars, the patent to revenue life-cycle is not without its uncertainty.
Example
HealthKare Co has just patented a new method for a non-invasive flu remedy that has been valued at $2M. It does not have any revenue yet but in comparing its offering to the space of similar company values, it determines that health care patents are valued at 10x. Total Value: $20M
Exit Multiple
Explanation and Use Case
The exit multiple method is purely an investor based metric where investors require a certain return on investment and determine value based on money invested and the multiple expected. Countries in the World Cup do the same thing with their coaches. Coaches are hired (invested in) and have set expectations of what the goals are (milestones) and depending on how they perform will determine if the investment is successful. If they win the World Cup when the goal was to simply put on a good performance it would be considered a fantastic investment, yet the opposite would be a disaster.
Pros and Cons
This is another method that relies on simplicity and subjectivity. It can be a great gauge to help rationalize an investment opportunity similar to the market share/market size metric but the main downfall is that it is also not based on the business at hand, simply the investor’s required return.
Example
Refinery Group, a technology focused VC firm, would like to achieve 10x on their early stage investments. They are considering investing in a SaaS HR solutions provider’s Series A with an expected exit value of $140M. The company is looking to raise $4M. Total Value: $10M
Matchup to Watch Not so much a single match, but more a question if anyone can upset group favorite Acquisition Value (Attach Rate)? They seem to have peaked at the right time with the perfect blend of leadership and disruptive product family in a space where many of the larger companies are looking to grow inorganically.
Today we get to know Group C, the metrics on Customers. Much like the fans at a packed Estadio Das Dunas in Natal, Customers are the lifeblood and barometer of any successful company. When things are going well they will cheer and drum and vuvuzela their support, yet when things are not going well they will boo and berate your squad as if there were no tomorrow. In a company and in a soccer game, you want the former not the latter and these metrics can help determine whether your company will incite riots or show unwavering loyalty.
Explanation and Use Case Churn is simply a measure of how many customers you are losing. These are the customers that are not renewing contracts, walking away from upgrades, etc. These are all problems you want to avoid because recurring customers can be the sweet spot for many companies. Much like season ticket holders not renewing after a relegation year, poor performance can drag down your top line as well as accelerate the after-effects of losing your most-valued customers and the resulting diminished Net Promoter Score (NPS).
Pros and Cons The true benefit of this metric is not so much how it helps you value your company on its own, but it really helps provide input into the health of your business and the happiness of your customers. That, and it is a key piece on some of the other customer-centric metrics (we see you LCV). The main drawback is that churn alone is not a key leader in the valuation world, yet it is a strong contributor on a lot of other aspects of the customer valuation types. If customer valuation metrics is a soccer team, churn is a strong goaltender; it won’t win you any games, but it is absolutely vital to your success as a whole.
Example
RealData, a data analytics company, has 600 customers and only churns 5% of them over time. They have $6M in Annual Recurring Revenue (ARR) and are valued at $24M. Their competitor DataSlice also has 600 customers but churns 30% of them over time and only has $4M in ARR which has diminished their total value by $14M when compared to RealData. Total Value $10M
2. Enterprise Value/Lifetime Customer Value
Explanation and Use Case Lifetime customer value is a way to gauge how much a single account is worth over their life. Think the total amount of revenue you would receive from season ticket holders over their lifetime purchase period (tickets, drinks/food, apparel, etc.) less any churn. That can be a pretty powerful number when valuing a business, especially when customer acquisition costs are low. The rule of thumb for a strong LCV is it must be greater than 3x Customer Acquisition Cost (how much it costs to get a customer). A low CAC and high LCV is like playing with Brazil in this year’s World Cup. Absolutely stacked in player talent that will put on a great show for the fans game in and game out (high LCV) and it is already the most passionate country in the world for the sport (low CAC).
Pros and Cons
The main advantage of this metric is you know just how much to expect from each customer and can really take that into account when building out your sales team and corresponding metrics (deals per salesperson, new accounts needed, deal size expected, etc.). The drawback to this is that no customer is the same and making generalizations about your average customer can be dangerous. If your original customers loved the product (high LCV) but that only happened to be a subset of the true population’s thoughts on your solution which were noticeably lower (lower LCV), then you would have overvalued your average customer.
Example
Ship.Ly a consumer facing on-demand delivery service was just valued at $10M and their customers have an LCV of $8K. Door2Door, a competitor in the space looking to raise a round has an LCV of $10K. Total Value: $12.5M
3. Enterprise Value/Monthly Active Users
Explanation and Use Case
What is MAU? Simply ask WhatsApp what MAU is and they will have a few billion answers for you. Monthly Active Users (MAU) is a hot metric these days for pre-revenue or fast growing consumer-focused companies because it allows companies to measure more than just how many visitors they get to their website/app by showing how many of them are actually using it on a regular basis. The ability to demonstrate strong active user growth is a great asset when trying to monetize or show meaningful traction.
Example
WhatsApp was purchased for $19B with 450M MAU’s or 42x. MessgMe is a SMS-based messaging service looking to raise a B round with 300K MAU’s. Total Value $12.6M
4. Market Share/Market Size
Explanation and Use Case
How big is the Total Addressable Market (TAM) and what portion of it do you expect to control? Market size and expected share can be a great tool when determining the value of your company. Lots of questions can be asked and answered with this metric (Is it feasible that a company can be worth 100m when the market is 500m? 2bn?, etc.). This can be valuable for pre-revenue companies or companies looking to greatly expand their customer base as it provides them context about what exactly they need to do to achieve the market share they desire.
Pros and Cons
If done properly, market share % goals can be extremely useful in setting a roadmap for the successful execution of the company vision. The main drawback is that without other strong customer metrics to support the goal, it becomes an unreasonable assumption that will most likely go unachieved. Much like team USA was laser focused in their preparation for their game against Ghana, calling it their “world cup final” even though it was only Group stage game 1 of 3, a company with strong metrics to back up their market share % goal (avg. deal size, LCV, churn, growth rate, etc.) can hopefully benefit from the fruit of their labor in similar fashion to USA’s outcome yesterday
Example
CapCo is looking to disrupt the men’s headgear business and take share from market leader HEADS. CapCo currently owns 10% of the $1B market and expects to own 20% of the $1.5B market 5 years from now. Total Value: $300M
Match to Watch
Which MAU team will you get this time around? The behemoth or the doormat? Look to see how MAU can hold up against Lifetime Customer Value in what could be a pivotal matchup for 2nd place!
Breaking news out of the Governing Body of the CVWC! Due to improper accounting practices, EV/Earnings has been removed from group play and EV/Sales Expense has been included! Its a disappointing turn of events because our CVWC analysts had EV/Earnings as a dark horse to win the tournament because it can be an extremely valuable term for later stage companies by providing “smoother” earnings analysis and its ability to analyze the business as a whole.
Day Two of the Valuation World Cup brings us Group B: the business metrics methods. This has to be the group of death in the tournament, considering these are tried and true methods applicable to one-year-old startups and hundred-year-old behemoths. Get your spreadsheets ready, cause it’s about to go down…
Explanation and Use Case
The first of the “multiples” approaches,” EV/Sales (aka: EV/Revenue) values a company based on the dollar value of their sales, typically on an annual basis. By looking to comparable companies – in size, stage, business model and sector – an average multiple can be determined and applied to the company’s revenue. Using the revenue run rate of the next twelve months, rather than the previous years’ sales, can be a better measure of value for fast growing startups, so long as you use a forward multiple to maintain timing consistency.
This method is especially useful when valuing revenue-generating companies currently operating at a loss, as it provides a measure tied to financial health without relying on earnings.
Pros and Cons
EV/Sales is like a strong cross from a sprinting winger into the box for a 6’8” striker: simple but effective. As long as the comparables are carefully chosen, this metric can provide great insight into both current value and anticipated growth prospects. The higher the multiple, the greater the upside potential.
A metric this simple has its downsides as well, namely with how varied business models can be. The costs to make a dollar of sales will be vastly different for a company generating word-of-mouth sales versus a competitor with a full-time direct sales team. When choosing comparables, it’s not enough to simply pick a number towards the middle of a range. Careful consideration must be given to how these costs and margins will evolve.
Example
SecuriCloud is out raising a seed round after booking $100k of sales over the past year. Silver Lining Security recently raised their Series A at a pre-money valuation of $5M with revenue of $250k, and SkyKeys was recently bought by CloudTight.ly for $6M with estimated sales of $500k. All three companies have margins of 55-75% and have small, experienced sales teams. It appears the multiple should fall between 12-20x. Total Value: $1.6M.
2. Enterprise Value/EBITDA
Explanation and Use Case
With EV/Earnings out of the tournament, it’s up to EV/EBITDA to defend what investors are really looking for: returns! EBITDA (Earnings Before Interest, Tax, Depreciation and Amortization) falls between Revenue and Earnings for a happy middle-ground indication of financial performance, including cost of sales but foregoing tax, financing and non-cash expenditures. Once again, look to similar firms to determine the appropriate multiple.
EV/EBITDA is useful for companies with strong revenues and positive cash flows, but lacking consistent earnings, with applications well beyond Series C+ rounds.
The Pros and Cons
EBITDA is an unlevered measure of the pre-tax cash flows, and, should also provide consistent comparisons across time measuring growth in sales and margins. Also, the “pre-tax” component eliminates tax-loss carry forwards which, while valuable, are not indicative of future performance.
However, one useful part of the EV/EBITDA metric can be rather meaningless for startups: it measures the unlevered cash flows to allow for comparisons across different capital structures. Most early stage startups are 100% equity-owned already.
Example
CornBorn Energy is raising a Series C to fund their sixth ethanol plant. Despite consistent losses over the past five years, their EBITDA has grown tenfold over that time to $100M. Other publicly traded ethanol companies, regardless of their leverage position, have EV/EBITDA multiples in the 5-7x range. Total Valuation: $600M
3. EV/Sales Expense
Explanation and Use Case
Two sales multiples? It looks like they’ve put East Germany and West Germany in the same bracket! EV/Sales Expense is simply the Enterprise Value compared to how much does it cost to generate revenue (Sales). This is a very telling metric about the priorities of a company as well as what stage of the life-cycle they are in (land grab/scale vs. harvest/mature). This is a widely used metric when trying to determine how effectively a company can drive top line growth.
The Pros and Cons
A good (high) EV/Sales Expense ratio is like that same strong cross to a 6’8 striker in the box but this time you are up 2-0 in the 85th minute; simple, effective, and most importantly a great way to get a positive long-term outcome (profitability/win the game). A bad (low) EV/Sales Expense ratio is that same cross to that same striker but this time you are down 3-0 in 88th minute and you had to send your whole team ahead leaving you completely exposed to any counter-attack. Simple, effective, but unfortunately not a great way to get a positive long-term outcome.
Example
Security startup RainEye is looking to raise a Series C and has $20M in sales but has $12M in Sales Expense. The prevailing analysis of similar security companies at their stage (land grab/scale) revealed an average EV/Sales Expense multiple of 4x. Total Value: $48M
4. Discounted Cash Flow
Explanation and Use Case
Open your “Intro to Finance” textbooks to Chapter 1 and you’re likely to find the Discounted Cash Flow analysis. The model relies on a cost of capital and a set of projections regarding future returns. Then discount those future cash flows back to find your present value. I’m sure if Ian Darke was there to see the naming of this method, I’m certain he’d say, “Clever, that.”
This has been the preferred model for everyone from book building investment bankers to Fortune 500 middle managers determining capital budgeting.
The Pros and Cons
The Discounted Cash Flow analysis method is like Spanish tiki-taka futbol (bear with me). At first glance, the DCF is an incredibly complex system, but in actuality a very logical progression of precise movements. Every bit flowing into the next, and finally all is brought back to the present. This brought Spain the World Cup in 2010, no?
But precision does not always mean accuracy.
Example We have given enough written examples, see the video tutorial below!
Match to Watch
In a group of behemoths, it will be interesting to see how the three income statement line items will stack up against one another. At what point do startup revenues have to generate cash flows? And when can we see those cash flows translate to business earnings? And can any of these one-off metrics stack up against the completeness of a DCF?