In college I studied both Finance and Economics and I really enjoyed the combination that both degrees offered me. Finance gave me a great sense of numbers and analyzing companies and Economics offered me more on organizational theory and incentive behavior. When combined, these studies offered me a holistic viewpoint into why businesses make decisions and how to analyze those decisions and this has been instrumental in my career working with hundreds of startups in the venture ecosystem.
One thing that has stuck with me since college is the idea of price elasticity and in my career I have been fortunate to work with a lot of marketplace companies where I see the theory of price elasticity being proven out daily.
As I alluded to in my last post, I have been wanting to write a more comprehensive post on this topic and with long term rental/corporate housing startup, 2nd Address’ announcement of its $10M Series C from GV, I figured now a better time than ever.
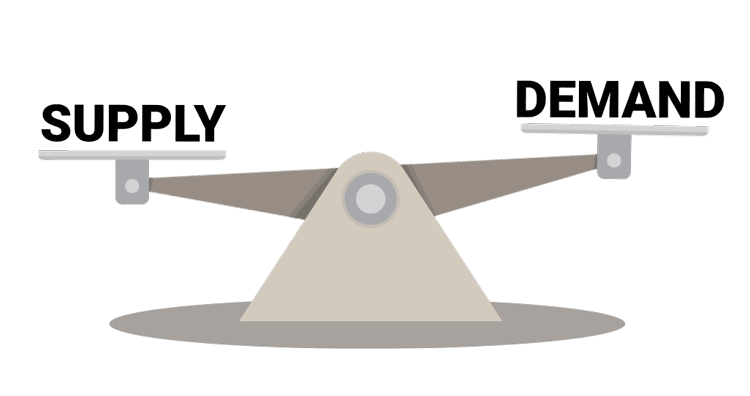
For a quick econ 101 lesson, Price elasticity is the degree of responsiveness (change in quantity) for supply or demand based on a change in price. There are 2 extremes of price elasticity of demand, highly inelastic demand and highly elastic demand.

Highly Inelastic Demand is that there is no or minimal change in demand for a given change in price. The example that my professor always used was Insulin but for a more 2019 version we can use the excessive drug prices that big pharma can charge (looking at you Shkreli!). In this example, a company can raise prices as much as they want because of the nature of the good (life saving drugs) that the demand will remain the same and users are forced to pay the high prices in order to live. This gives businesses extreme pricing power over consumers.
Highly Elastic Demand is the opposite where any change in price will drastically change the demand for the good. An example of this would be the price difference between Uber and Lyft. If Uber and Lyft prices differ greatly the user would choose the lower cost ride (all other things equal and switching costs being de minimis). This gives users a large degree of indirect control over the pricing dynamics of the marketplaces as businesses must be hypersensitive to changing price in fear of losing customers.
With marketplaces such as Uber, Lyft, Airbnb, Gametime Getaround, 2nd Address, and many others, one of the main ways they are compensated is on their take rate (called many things by many companies) and that rate is the fees they charge to manage the marketplace and facilitate transactions. The supplier (Drivers in Uber/Lyft example) then get to keep the remainder of the fare minus the take rate.
Uber and Lyft charge these to pay engineer salaries to keep the app updated and to fund their marketing spend to attract both drivers and riders (#expensive!). Getaround charges their rate to keep their ecosystem online and work with their various support teams to get new cars on the road and keep consumers happy.
This take rate varies by company and marketplace model and a lot of other factors as you can see by the examples below.
| Company | Industry | Take Rate |
| Airbnb | Home sharing/Travel | 0 – 20% |
| 2nd Address | Home sharing/Travel | 7 – 26% |
| Uber | Rideshare/Mobility | ~25% |
| Lyft | Rideshare/Mobility | ~25% |
| Getaround | Rideshare/Mobility | 40% |
So why do Airbnb and 2nd Address and Uber and Lyft have similar take rates? Why is Getaround far and away the highest percentage? Many reasons but one partial explanation is price elasticity.
In our Econ 101 example above, Uber and Lyft are near identical services and as a result are competing mostly on price and are fairly elastic goods so it makes sense that their take rates are similar.
Getaround on the other hand is a fairly inelastic good due primarily to the nature of the service it facilitates. Getaround offers consumers the use of someone’s car when that car is not being used by the owner. This is about as inelastic as one can get in consumer. The use of the car, which otherwise remains unused/parked in its parking spot, is right up there with insulin as an inelastic good because the opportunity cost is next to nothing to have someone rent it. This differs from Uber/Lyft where the car owner actually needs to drive the car and provide a service and is one of the main reasons why Getaround can charge so much. Some may say Getaround is letting the suppliers or car owners (disclaimer: I am one) off easy by only charging 40%!
While take rates vary for numerous reasons and are only one piece of the puzzle, I find it fascinating their role in the interplay between incentives, consumer behavior, and business growth. This will be ever interesting to watch as Uber, Lyft, and Airbnb march towards IPO and focus on a path to (or maintaining) profitability while other competitors raise larger rounds and try to scale their own businesses in the behemoths shadows. It can be appealing to use the lever of take rate to impact business performance and the financial model but if we’ve learned anything from this post is that the take rate may impact a lot more than the top line growth due to its price elasticity!
